Apple, Inc. (AAPL), as many know, plays a key role in the equity market: as a top “risk-on” trading name, a longer term holding in many institutional/individual portfolios, and its impact on the broader markets.
Apple is the #1 weighted holding in both the S&P 500 (SPY) and Nasdaq (QQQ) Indexes:
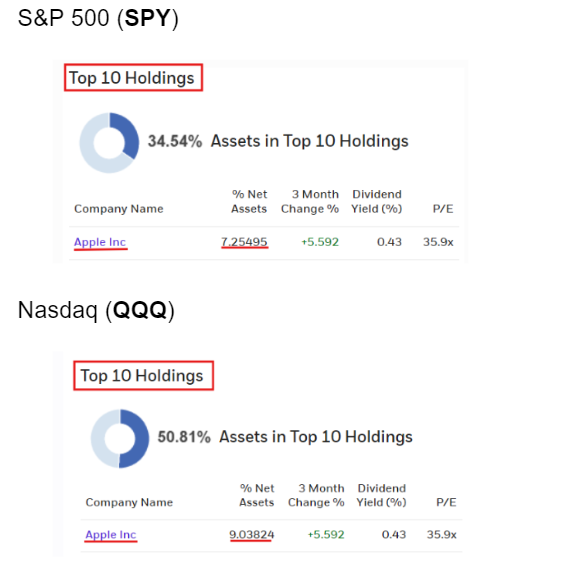
So, as active market participants, it’s a good idea for us to monitor AAPL closely and include it, as one data point, in our broader market analysis.
As we head into the end of the October month and into the November U.S elections, historically there tends to be seasonality “tailwinds” or market outperformance.
However, there are many debates among market professionals about whether this has already been “baked in” with the bullishness we’ve seen to date in October (S&P up 2.6%) vs. what has traditionally been an underperforming/volatile month at this juncture going back the past 20 years.
The other side of the debate is that we’re in a period of high global liquidity with bullish sector trends, and therefore you would expect to see stronger than expected or above “normal” October seasonality patterns.
The winner of this debate remains to be seen, but in the meantime we want to keep our eye on Apple:
Apple (AAPL) – Daily Chart
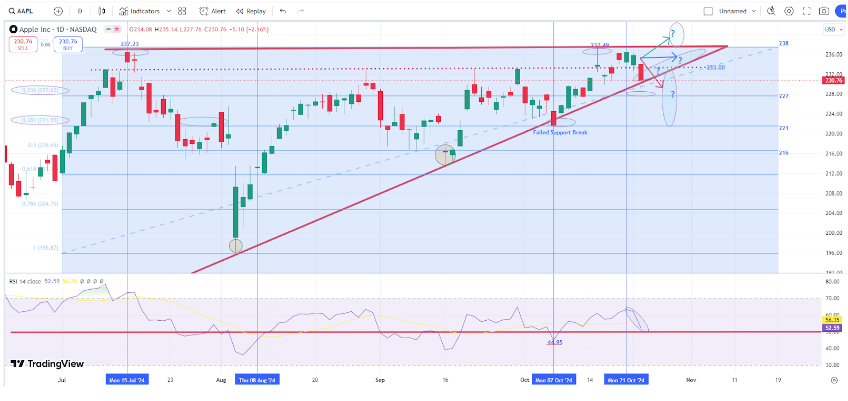
Looking deeper technically at the AAPL daily chart, we can see:
- Since July, AAPL has been consolidating into an “ascending triangle” pattern (which often – but not always – is a price continuation pattern). A price break/close ABOVE the horizontal triangle line, along with strong conviction, would be a bullish development. A price break/close BELOW the upward diagonal support line, especially with any conviction, would be a bearish development.
- The price on 10/7 tried breaking below the upward diagonal support line, but failed and bounced back up – a positive development.
- On 10/15, price tried but was not able to close above $237 (the former highs of July) and has since retraced.
- Again on 10/23, price started breaking the longer term support line, but buyers came in below around the 23.6% fibonacci retracement level (Aug lows to Oct highs) and pushed price back up to close RIGHT AT this key support line. We want to watch this general area very closely.
- The Momentum/Relative strength (RSI indicator) since 10/21 has been trailing off a bit – but remains above the halfway/50 level. We want to watch to see if momentum stays above this 50 level and bounces (along with price bouncing up from the current upward diagonal support line) or if price continues downward, and especially if the coinciding RSI momentum indicator starts moving below 50 and the former low of 44.95 on 10/7.
- AAPL earnings are scheduled to be released after market hours on 10/31/24 and could be the catalyst for a definitive bullish or bearish move out of this longer term consolidation pattern, along with more weight of the evidence of broader market “risk-on” (bullish) vs “risk-off” (bearish) tendencies heading into November and beyond.
That’s a lot of info to digest!
How do you simplify it?
What’s the best way to keep tabs on stocks like AAPL?
Market Rover!
Happy Trading!