
“The Principle of Polarity” in stocks is a fundamental concept in technical analysis – and it’s invaluable to us as traders trying to find the right stocks to work with.
It explains that once a resistance level is surpassed, it transforms into a support level, and vice versa. This phenomenon occurs due to shifts in demand and supply at those price points.
Understanding this principle is crucial for grasping market psychology and price action, aiding traders in making informed decisions based on historical price movements.
Let’s take a quick look at the weekly chart of NRG Energy (NRG) and how you can see this basic concept come into play.
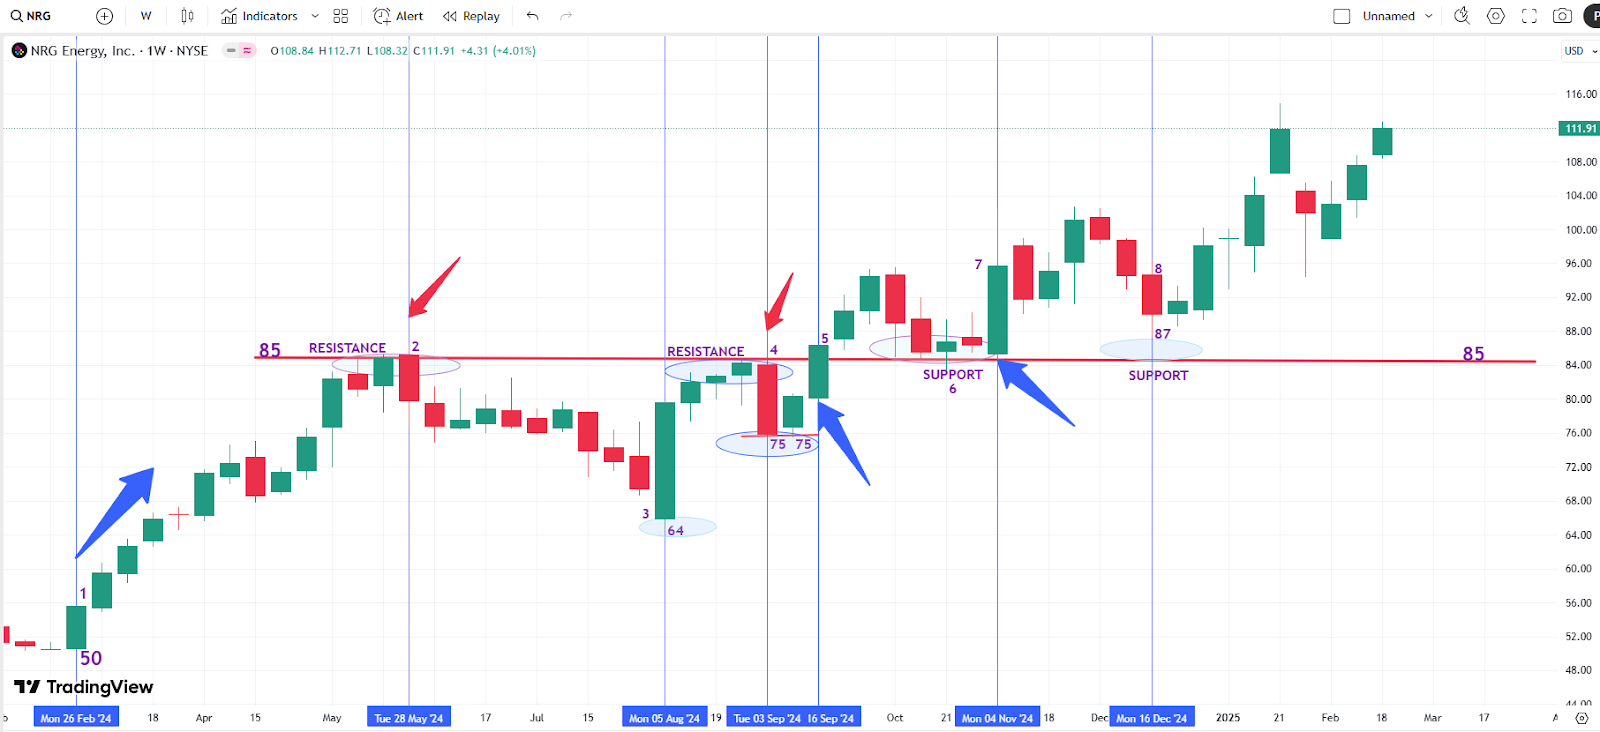
Beginning the week of February 26th, 2024 (#1), the $50 stock price eventually rises to approximately $85.00, but struggles to close above this level.
Price then retraces during the week of May 28th (#2), going on to reach a weekly low of $64 (#3).
The $85 area above indicates a crucial potential “resistance” or market memory, where supply outpaced demand, and buyers were no longer willing to pay those prices. This area should be monitored the next time the price approaches.
The price makes another attempt to climb higher but, once again, fails to close above the $85 “resistance” area. As a result, the price sells off the week of September 3rd (#4), dropping to a low of $75 (note that this level is higher than the previous weekly low of $64).
The following week, the price closes with a green candle, and sellers are unable to push prices significantly lower from the $75 low of the previous week, indicating that downward selling pressure is easing.
During the week of September 16th, the price finally breaks above the prior $85 resistance level and closes above it (#5). Moving forward, the price revisits and “retests” this lower $85 level multiple times (#6), but buyers consistently step in to buy around this area, preventing the price from falling further.
According to the Principle of Polarity, this $85 area has now transitioned into a potential support level.
In the week of November 4th (#7), the price opens around the $85 level, with buyers stepping in forcefully, driving prices higher and closing with a strong green directional candle. The price then retraces (#8) during the week of December 16th to a low of $87, but it never falls back below the $85 support level and then continues higher.
This demonstrates the Principle of Polarity, where previous resistance has now become a support level and a crucial area of market memory moving forward.
While you can perform this basic technical analysis of supply and demand yourself, our proprietary trend/trading Market Rover algorithm simplifies the process for you. It identifies an asset’s primary trend and alerts you when a potential trade opportunity arises within that trend.
For instance, in NRG Energy, the stock is currently in a “green” background upward trend, and the algorithm recently signaled a “buy” trade idea on February 18th, 2025.
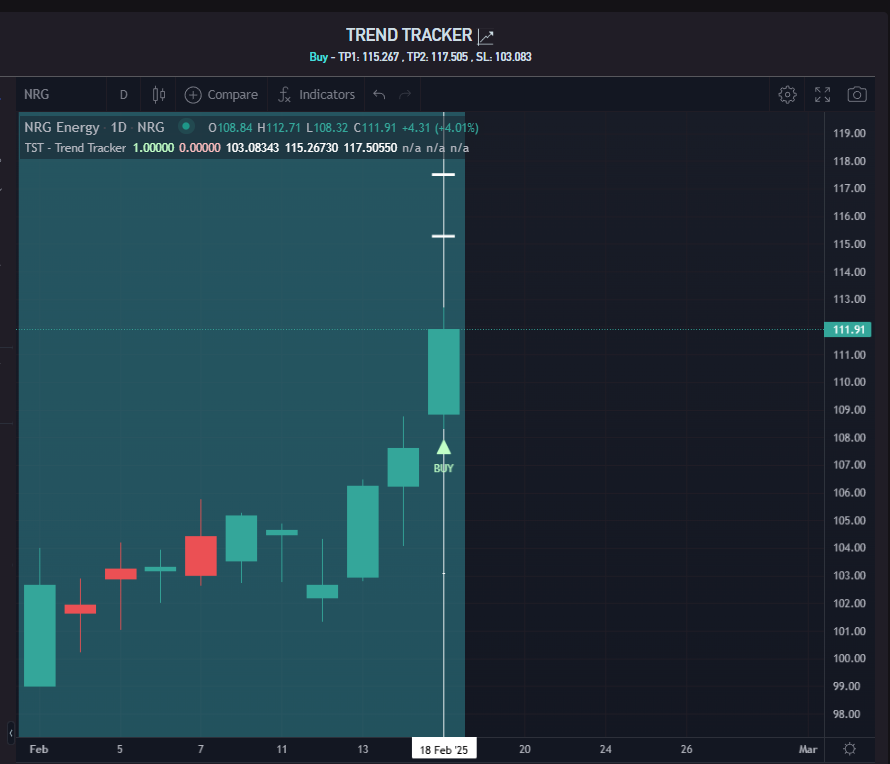
With continued momentum, Market Rover has identified the following potential “trade” target prices for NRG:
- An initial potential Target Price (T-1) of approximately $115
- A secondary potential Target Price (T-2) reaching $117.
That’s a LOT easier than all that manual technical analysis from the chart, isn’t it?
And that’s what you get with Market Rover – sophisticated analysis and actionable trade ideas in just a few clicks.
Happy Trading!


