
In this report you will learn how one specific candle pattern has tracked NVIDIA since March 26th almost $175 points to NVIDIA’s most recent low. >>>>
It kept you on the downside if you knew how to read it.
Let’s break it down.
There are many ways to spot potential price reversals by identifying candlestick patterns.
When these patterns happen at additional areas of pricing significance, such as diagonal/horizontal support and resistance levels, moving averages, Fibonacci retracements, etc., they tend to lend even more significance.
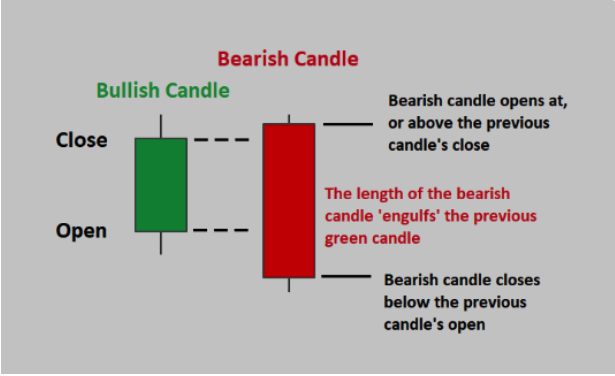
Let’s go through a complete example and cover a candlestick pattern known as a “Bearish Engulfing Candlestick Pattern”, the exact one that unveiled the NVIDIA short.
These patterns are identified in directional uptrends, and when one candle “engulfs” the real body (the open and close range) of the previous day’s candle.
They are especially important in extended or maturing uptrends and/or recent accelerated price moves upward.
As the name implies, the pattern is commonly bearish, signifying a potential reversal in price or trend.
If you don’t take anything from this report, TAKE THIS:
Bearish Engulfing Candlestick Pattern
OK…so let’s break down the NVIDIA drop.
We’ll examine Bearish Engulfing Patterns, areas of technical importance, and momentum that helped us take advantage of near term trading opportunities while protecting long term portfolio positions.
As the broader markets turned in late October/early November 2023, the Artificial Intelligence (AI)/Semiconductor trade gained momentum with NVDA being the leader and moving up in a strong uptrend.
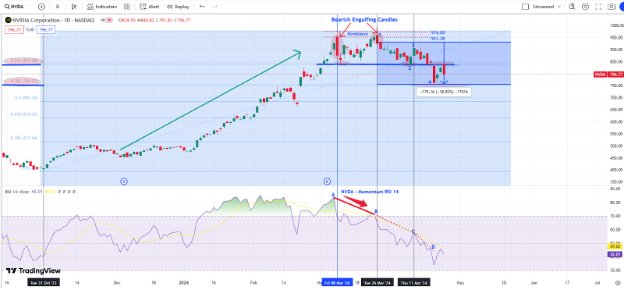
Then on Friday March 8th 2024, a “Bearish Engulfing Candlestick” pattern first emerged with price retracing the following day but holding a technical 23.6% Fibonacci retracement level.
Price then again made another attempt upward, but right around the former resistance level price was rejected AND formed another Bearish Engulfing Candlestick on Tuesday, March 26th.
This series of technical events was of significant importance:
(1) Two Bearish Engulfing Candlestick formations
(2) Price rejection at a former resistance level and
(3) A loss of momentum/relative strength that can be seen underneath in the RSI indicator moving down from A to B
As price began retracing, the technical 23.6% Fibonacci retracement level below again came into focus, with price temporarily bouncing upward (#2 – #3) , BUT another “heads up” that maybe the bounce was short lived as momentum/relative strength underneath was continuing to deteriorate ( C – D ).
Price then did break this prior support level on continued weakening momentum (D), stopped going down at the next technical Fibonacci 38.2% retracement level below (#4), bounced upward, but was rejected at this former support level which now acted as resistance.
And as I said above, since the Bearish Engulfing Candlestick pattern on March 26th, price has now formed a series of lower highs and lower lows (#1 – #4), moving down approximately $175 to NVIDIA’s most recent low.
THAT’S POWERFUL!
This pattern is not proprietary. We didn’t make it up.
It’s legit, and it shows reversal patterns as they develop.
See you on the next one,
Serge & JB


